10 Best Quantum Computing stocks To buy in 2024
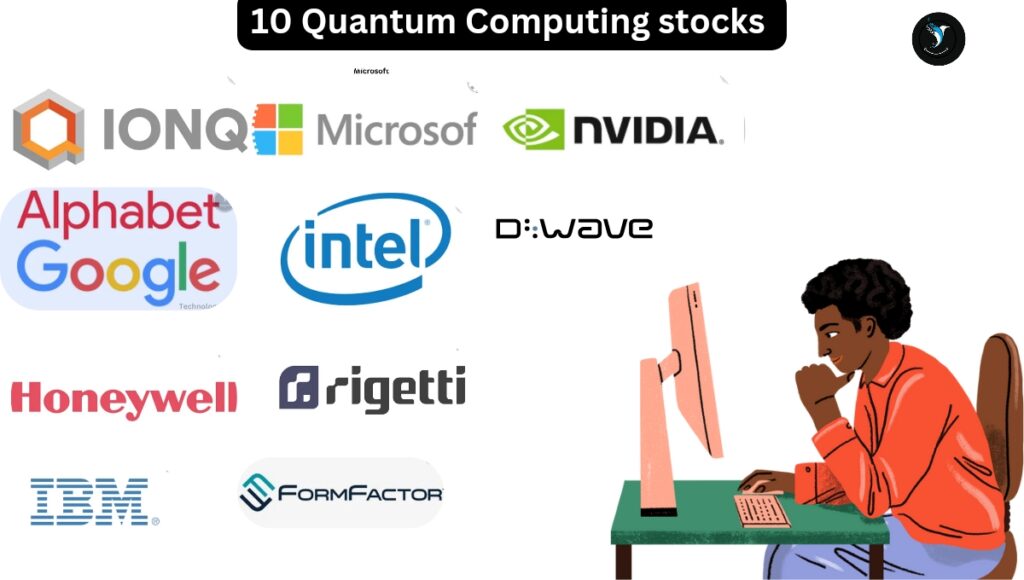
10 Best Quantum Computing stocks To buy in 2024 :
- Nvidia Corporation (NVDA)
- IONQ
- Alphabet (GOOGL)
- IBM
- Microsoft (MSFT)
- intel Corporation (INTC)
- Honeywell (HON)
- Formfactor
- rigetti (RGTI)
- D Wave (QBTS)
Nvidia Corporation (NVDA)
What Nvidia Corporation do?
- Founded in 5 April 1993, NVIDIA has a rich history of innovation They are credited with creating the first successful consumer-oriented GPU in 1999, which revolutionized the gaming industry.
- Nvidia is a tech company that makes some of the most powerful computer chips around, specifically focusing on graphics processing units (GPUs). These chips are essential for high-performance computing tasks that require a lot of graphical processing power.
- Designs and manufactures graphics processing units (GPUs), which are essential components for generating visuals on computers.
- In 1997, NVIDIA gained a foothold in the computer gaming industry with the launch of the RIVA series of graphics processors.
Financials (Fundamentals) of Nvidia
Valuation
- Market Capitalization – 2.22T
- Enterprise Value (MRQ) – 1.505 T
- Enterprise Value/EBITDA (TTM) – 63.3334
- Total Shares Outstanding – 2.5 B
- Number of Employees – 29.6 K
- Number of Shareholders – 382
- Price to Earnings Ratio (TTM) -73.6765
- Price to Revenue Ratio (TTM) – 35.9444
- Price to Book (FY) – 50.4198
- Price to Sales (FY) – 36.0022
Price History
- Average Volume – (10 day)62.574 M
- 1- Year Beta – 1.8692
- 52 Week High – 974
- 52 Week Low – 251.2983
Dividends
- Dividends Paid (FY) − 395 M
- Dividend Yield Forward – 0.0182
- Dividends per Share (FY) – 0.1600
Margins
- Net Margin (TTM) – 48.85%
- Gross Margin (TTM) – 72.72%
- Operating Margin (TTM) – 54.12%
- Pretax Margin (TTM) – 55.51%
Balance Sheet as of Jan 31, 2024
- Quick Ratio (MRQ) – 3.6744
- Current Ratio (MRQ) – 4.1713
- Debt to Equity Ratio (MRQ) – 0.2572
- Net Debt (MRQ) – 14.928 B
- Total Debt (MRQ) – 11.056 B
- Total Assets (MRQ) – 65.728 B
Operating Metrics
- Return on Assets (TTM) – 0.5567
- Return on Equity (TTM) – 0.9146
- Return on Invested Capital (TTM) – 0.6981
- Revenue per Employee (FY) – 2.058 M
Income Statement
- Basic EPS (FY) – 12.0535
- Basic EPS (TTM) – 12.0562
- EPS Diluted (FY) – 11.9326
- Net Income (FY) – 29.76 B
- EBITDA (TTM) – 34.479 B
- Gross Profit (MRQ) – 16.791 B
- Gross Profit (FY) – 44.301 B
- Last Year Revenue (FY) – 60.922 B
- Total Revenue (FY) – 60.922 B
- Free Cash Flow (TTM) – 27.021 B
why to invest in nvidia?
- Nvidia is a leading manufacturer of graphics processing units (GPUs), which are in high demand for gaming, artificial intelligence (AI), and data centers. The growth of these sectors is expected to continue to drive demand for Nvidia’s products.
- Artificial intelligence is a rapidly growing field, and Nvidia’s GPUs are well-suited for AI applications. This positions Nvidia to benefit from the continued development of AI.
- Nvidia’s stock has grown 18.8% in the past month (as of March 15, 2024).In the last six months, Nvidia’s stock has seen a significant increase of 92.9%.Nvidia’s stock has surged an impressive 551% over the past 18 months.
- Analysts at Goldman Sachs had pegged Nvidia as “The Most Important stock on planet Earth”.
Nvidia profile
| Sector | Electronic Technology |
| Industry | Semiconductors |
| Employees (FY) | 29600 |
| Nvidia Details | NVIDIA Corp engages in the design and manufacture of computer graphics processors, chipsets, and related multimedia software. It operates through the following segments: Graphics Processing Unit (GPU), Tegra Processor, and All Other. The GPU segment comprises of product brands, which aims specialized markets including GeForce for gamers; Quadro for designers; Tesla and DGX for AI data scientists and big data researchers; and GRID for cloud-based visual computing users. The Tegra Processor segment integrates an entire computer onto a single chip, and incorporates GPUs and multi-core CPUs to drive supercomputing for autonomous robots, drones, and cars, as well as for consoles and mobile gaming and entertainment devices. The All Other segment refers to the stock-based compensation expense, corporate infrastructure and support costs, acquisition-related costs, legal settlement costs, and other non-recurring charges. The company was founded by Jen Hsun Huang, Chris A. Malachowsky, and Curtis R. Priem in January 1993 and is headquartered in Santa Clara, CA. |
⚡Note – Nvidia’s GPUs are generally more expensive than its competitors. The high growth potential also translates to higher volatility, meaning the stock price can fluctuate significantly. While Nvidia is the current leader in AI chips, the landscape is constantly evolving. Companies like AMD and Intel are investing heavily in catching up, and future competition could erode Nvidia’s market share.
IONQ Inc
What Ionq inc do?
Quantum Computing Hardware and Software: IonQ builds both the physical quantum computers and the software needed to run them . Their specialty is in what’s called “trapped ion” technology, a method for creating qubits, the building blocks of quantum computers.
Financials (Fundamentals) of ionq
Valuation
- Market Capitalization – 1.94 B
- Enterprise Value (MRQ) – 2.196 B
- Enterprise Value/EBITDA (TTM) – —
- Total Shares Outstanding – 208.23 M
- Number of Employees – 324
- Number of Shareholders – 285
- Price to Earnings Ratio (TTM) – —
- Price to Revenue Ratio (TTM) – 85.6913
- Price to Book (FY) – 3.9193
- Price to Sales (FY) – 84.5524
Price History
- Average Volume (10 day) – 10.666 M
- 1-Year Beta – 3.9423
- 52 Week High – 21.6000
- 52 Week Low – 4.6100
Dividends
- Dividends Paid (FY) – 0
- Dividend Yield Forward —
- Dividends per Share (FY) – 0
Balance Sheet as of Dec 31, 2023
- Quick Ratio (MRQ) – 10.4937
- Current Ratio (MRQ) – 10.4937
- Debt to Equity Ratio (MRQ) – 0.0167
- Net Debt (MRQ) – −347.336 M
- Total Debt (MRQ) – 8.105 M
- Total Assets (MRQ) – 555.427 M
Margins
- Net Margin (TTM) : −715.77%
- Gross Margin (TTM) : 16.15%
- Operating Margin (TTM) : −715.70%
- Pretax Margin (TTM) : −715.56%
Operating Metrics
- Return on Assets (TTM) – −0.273
- Return on Equity (TTM) – −0.2996
- Return on Invested Capital (TTM) – −0.2965
- Revenue per Employee (FY) – 68030.8642
Income Statement
- Basic EPS (FY) – −0.7788
- Basic EPS (TTM) – −0.7781
- EPS Diluted (FY) – −0.7788
- Net Income (FY) – −157.771 M
- EBITDA (TTM) – −147.379 M
- Gross Profit (MRQ) – −563 K
- Gross Profit (FY) – 3.559 M
- Last Year Revenue (FY) – 22.042 M
- Total Revenue (FY) – 22.042 M
- Free Cash Flow (TTM) – −92.514 M
Why to invest in Ionq?
- IonQ, Inc. is a leader in quantum computing. IonQ builds powerful computers that use the strangeness of quantum mechanics to tackle super hard problems that regular computers can’t. These problems could be in science or business, and could help us make amazing discoveries or solve important challenges.
- Unlike tech giants with diverse portfolios, IonQ offers a direct way to invest in the pure potential of quantum computing.
- IonQ has shown impressive revenue growth, suggesting there’s a demand for their quantum computing products and services. This could be an indicator of future profitability.
IONQ Profile
| Sector | Electronic Technology |
| Industry | Computer Processing Hardware |
| Employees (FY) | 324 |
| Ionq Details | IonQ, Inc. develops and manufactures quantum computers. The firm specializes in quantum computing and quantum information processing. The company was founded by Christopher Monroe and Jung Sang Kim in 2015 and is headquartered in College Park, MD. |
⚡Note – Quantum computing is a very new field, and IonQ’s technology is still under development.IonQ’s stock price is currently high relative to its earnings, which means you’re paying a premium for the potential of future growth.IonQ faces fierce competition from other companies developing quantum computers.
Alphabet (GooGL)

What Alphabet do?
Alphabet Inc. is the parent company of Google and several other subsidiaries working on various futuristic technologies. It was created in 2 October 2015 through a restructuring of Google. Alphabet itself doesn’t really create products for consumers, but rather oversees the different companies under its umbrella.
Financials (Fundamentals) of Alphabet (GOOGL)
Valuation
- Market Capitalization – 1.76T
- Enterprise Value (MRQ) – 1.679 T
- Enterprise Value/EBITDA (TTM) – 16.8250
- Total Shares Outstanding – 5.893 B
- Number of Employees – 182.502 K
- Number of Shareholders – 9.121 K
- Price to Earnings Ratio (TTM) – 24.6503
- Price to Revenue Ratio (TTM) – 5.8711
- Price to Book (FY) – 6.2920
- Price to Sales (FY) – 5.9270
Price history
- Average Volume (10 day) – 38.42 M
- 1-Year Beta – 1.0533
- 52 Week High – 153.7800
- 52 Week Low – 99.7400
Dividends
- Dividends Paid (FY) – 0
- Dividend Yield Forward – —
- Dividends per Share (FY) – 0
Balance Sheet as of Dec 31, 2023
- Quick Ratio (MRQ) – 2.0966
- Current Ratio (MRQ) – 2.0966
- Debt to Equity Ratio (MRQ) – 0.1054
- Net Debt (MRQ) – −81.049 B
- Total Debt (MRQ) – 29.867 B
- Total Assets (MRQ) – 402.392 B
Margins
- Net Margin (TTM) – 24.03%
- Gross Margin (TTM) – 56.75%
- Operating Margin (TTM) – 28.05%
- Pretax Margin (TTM) – 27.91%
Operating Metrics
- Return on Assets (TTM) – 0.1923
- Return on Equity (TTM) – 0.2736
- Return on Invested Capital (TTM) – 0.2491
- Revenue per Employee (FY) – 1.683 M
Income Statement
- Basic EPS (FY) – 5.8428
- Basic EPS (TTM) – 5.8491
- EPS Diluted (FY) – 5.8006
- Net Income (FY) – 73.795 B
- EBITDA (TTM) – 99.843 B
- Gross Profit (MRQ) – 48.587 B
- Gross Profit (FY) – 174.304 B
- Last Year Revenue (FY) – 307.157 B
- Total Revenue (FY) – 307.157 B
- Free Cash Flow (TTM) – 69.495 B
Why to invest in Alphabet?
- Alphabet owns some of the most popular internet properties in the world, including Google Search, YouTube, Android, and Chrome. This gives them a huge advantage in the digital advertising market, which is still growing.
- Alphabet invests heavily in research and development, constantly innovating and creating new products and services to stay ahead of the curve.This diversification reduces reliance on a single revenue stream.Through constant innovation and diversification via new products and services, Alphabet reduces its reliance on a single revenue stream.
- Alphabet has a history of consistent revenue and earnings growth, and analysts expect this to continue. They are also profitable, with high margins compared to other tech companies, and they generate a lot of cash flow.
Alphabet Profile
| Sector | Technology Services |
| Industry | Internet Software/Services |
| Employees (FY) | 182502 |
| Alphabet Details | Alphabet, Inc is a holding company, which engages in the business of acquisition and operation of different companies. It operates through the Google and Other Bets segments. The Google segment includes its main Internet products such as ads, Android, Chrome, hardware, Google Cloud, Google Maps, Google Play, Search, and YouTube. The Other Bets segment consists of businesses such as Access, Calico, CapitalG, GV, Verily, Waymo, and X. The company was founded by Lawrence E. Page and Sergey Mikhaylovich Brin on October 2, 2015 and is headquartered in Mountain View, CA. |
⚡Note -Alphabet does not currently pay a dividends to its shareholders.Alphabet’s competitor include IBM, Microsoft, Meta and Apple.Alphabet’s financial performance is heavily reliant on advertising revenue. This creates a vulnerability during economic downturns, as businesses typically curtail advertising spending in such periods.increasingly stringent user privacy regulations could restrict Alphabet’s ability to collect data, potentially hindering their capacity for effective ad targeting.
Microsoft (MSFT)
what Microsoft do?
Microsoft is a tech company that makes a wide variety of software, hardware, and other technology products.Their most well-known software products are the Windows operating system for computers and laptops, and the Microsoft Office suite that includes programs like Word, Excel, and PowerPoint. They also make the Edge web browser and offer cloud-based subscriptions like Microsoft 365.Microsoft offers a cloud computing platform called Azure, and other online services like Bing search engine and Microsoft Teams communication platform.They also design and sell hardware, most notably the Xbox video game console and the Surface line of touchscreen computers.
Financials (Fundamentals) of Microsoft
valuation
- Market Capitalization – 3.094 T
- Enterprise Value (MRQ) – 2.839 T
- Enterprise Value/EBITDA (TTM) – 26.5159
- Total Shares Outstanding -7.43 B
- Number of Employees – 221 K
- Number of Shareholders – 83.883 K
- Price to Earnings Ratio (TTM) – 38.4581
- Price to Revenue Ratio (TTM) – 13.9533
- Price to Book (FY) – 15.3244
- Price to Sales (FY) – 14.9930
price history
- Average Volume (10 day) – 23.851 M
- 1-Year Beta – 1.0013
- 52 Week High – 427.8200
- 52 Week Low – 269.5191
Dividends
- Dividends Paid (FY) – −19.8 B
- Dividend Yield Forward – 0.7204
- Dividends per Share (FY) – 2.7200
Balance Sheetas of Dec 31, 2023
- Quick Ratio (MRQ) – 1.2046
- Current Ratio (MRQ) – 1.2180
- Debt to Equity Ratio (MRQ) – 0.4674
- Net Debt (MRQ) – 30.341 B
- Total Debt (MRQ) – 111.358 B
- Total Assets (MRQ) – 470.558 B
Margins
- Net Margin (TTM) – 36.27%
- Gross Margin (TTM) – 69.75%
- Operating Margin (TTM) – 44.17%
- Pretax Margin (TTM) – 44.47%
Operating Metrics
- Return on Assets (TTM) – 0.1977
- Return on Equity (TTM) – 0.3917
- Return on Invested Capital (TTM) – 0.2898
- Revenue per Employee (FY) – 958891.4027
Income Statement
- Basic EPS (FY) – 9.7181
- Basic EPS (TTM) – 11.1037
- EPS Diluted (FY) – 9.6843
- Net Income (FY) – 72.361 B
- EBITDA (TTM) – 117.836 B
- Gross Profit (MRQ) – 42.397 B
- Gross Profit (FY) – 146.052 B
- Last Year Revenue (FY) – 211.915 B
- Total Revenue (FY) – 211.915 B
- Free Cash Flow (TTM) – 67.445 B
why to invest in Microsoft?
- Microsoft is a large, well-established company with a history of profitability and consistent growth. This financial stability can be attractive to investors seeking reliable returns.
- Microsoft has a strong financial position with consistent profits and a healthy balance sheet
- Microsoft is heavily invested in artificial intelligence (AI) and integrating it into its products. This could lead to significant future growth opportunities.
- Microsoft pays a dividend to shareholders, which can provide a steady stream of income.
⚡Note -Microsoft’s stock price is not cheap, and the company’s future growth may already be priced in. Microsoft faces stiff competition from other tech giants like Apple, Amazon, and Google.
Microsoft profile
| Sector | Technology Services |
| Industry | Packaged Software |
| Employees (FY) | 221000 |
| Microsoft details | Microsoft Corp engages in the development and support of software, services, devices, and solutions. It operates through the following business segments: Productivity and Business Processes; Intelligent Cloud; and More Personal Computing. The Productivity and Business Processes segment comprises products and services in the portfolio of productivity, communication, and information services of the company spanning a variety of devices and platform. The Intelligent Cloud segment refers to the public, private, and hybrid serve products and cloud services of the company which can power modern business. The More Personal Computing segment encompasses products and services geared towards the interests of end users, developers, and IT professionals across all devices. The firm also offers operating systems; cross-device productivity applications; server applications; business solution applications; desktop and server management tools; software development tools; video games; personal computers, tablets; gaming and entertainment consoles; other intelligent devices; and related accessories. The company was founded by Paul Gardner Allen and William Henry Gates III in 1975 and is headquartered in Redmond, WA. |
Honeywell (HON)
what Honeywell do?
Honeywell founded in 1906. Honeywell is a multinational conglomerate based in Charlotte, North Carolina that invents and manufactures a wide variety of products and technologies.
Honeywell Aerospace Technologies designs and manufactures aircraft engines, avionics, flight management systems, and other parts for both commercial and military aircraft. They also provide service solutions to airlines and other aviation customers.
Honeywell (Performance Materials and Technologies) PMT manufactures specialty chemicals, materials, and advanced technologies that are used in a variety of industries, including automotive, oil and gas, and electronics.Honeywell Building Technologies manufactures heating, ventilation, and air conditioning (HVAC) controls, fire alarms, security systems, and other building automation products.
Honeywell (Safety and Productivity Solutions) SPS manufactures personal protective equipment, barcode scanners, mobile computers, and other products that help to keep workers safe and productive.
Financials (fundamentals) of Honeywell
Valuation
- SMarket Capitalization – 128.93 B
- Enterprise Value (MRQ) – 152.623 B
- Enterprise Value/EBITDA (TTM) – 15.7962
- Total Shares Outstanding – 652.182 M
- Number of Employees – 95 K
- Number of Shareholders – 35.911 K
- Price to Earnings Ratio (TTM) – 23.1791
- Price to Revenue Ratio (TTM) – 3.5410
- Price to Book (FY) – 8.0762
- Price to Sales (FY) – 3.5801
price history
- Average Volume (10 day) – 3.005 M
- 1-Year Beta – 0.8706
- 52 Week High – 210.8700
- 52 Week Low -174.8800
Dividends
- Dividends Paid (FY) – −2.855 B
- Dividend Yield Forward – 2.1852
- Dividends per Share (FY) – 4.1700
Balance Sheet as of Dec 31, 2023
- Quick Ratio (MRQ) – 0.9345
- Current Ratio (MRQ) – 1.2677
- Debt to Equity Ratio (MRQ) – 1.3582
- Net Debt (MRQ) – 13.441 B
- Total Debt (MRQ) – 21.536 B
- Total Assets (MRQ) – 61.525 B
Margins
- Net Margin (TTM) – 15.44%
- Gross Margin (TTM) – 39.01%
- Operating Margin (TTM) – 21.49%
- Pretax Margin (TTM) – 19.54%
Operating Metrics
- Return on Assets (TTM) – 0.0914
- Return on Equity (TTM) – 0.3476
- Return on Invested Capital (TTM) – 0.1717
- Revenue per Employee (FY) – 385757.8947
Income Statement
- Basic EPS (FY) – 8.5339
- Basic EPS (TTM) – 8.5320
- EPS Diluted (FY) – 8.4675
- Net Income (FY) – 5.658 B
- EBITDA (TTM) – 9.05 B
- Gross Profit (MRQ) – 3.7 B
- Gross Profit (FY) – 14.294 B
- Last Year Revenue (FY) – 36.647 B
- Total Revenue (FY) – 36.647 B
- Free Cash Flow (TTM) – 4.301 B
Why to invest in Honeywell?
- Honeywell involved in many different areas, from aerospace products to building technologies. This diversification can help the company weather economic downturns, because if one sector struggles, The other sectors can compensate for any downturn..
- Honeywell is targeting 4% to 7% annual revenue growth, which is solid growth for a mature company.
- Honeywell is committed to returning cash to shareholders through dividends and stock buybacks.Honeywell has a strong history of paying dividends and repurchasing shares, which can be a benefit to investors seeking income and stock price appreciation.
- Honeywell is a leader in innovation across its industries, and this focus on new technologies positions it well for future growth.
Overall, Honeywell could be a good investment for someone looking for a stable, dividend-paying company with long-term growth potential.
Honeywell profile
| Sector | Electronic Technology |
| Industry | Aerospace & Defense |
| Employees (FY) | 95000 |
| Honeywell details | Honeywell International, Inc. is a software industrial company, which offers industry specific solutions to aerospace and automotive products and services. It operates through the following segments: Aerospace, Honeywell Building Technologies, Performance Materials and Technologies, Safety and Productivity Solutions, and Corporate and All Other. The company was founded by Albert M. Butz in 1906 and is headquartered in Charlotte, NC. |
⚡Note The industrial conglomerate sector is competitive, and Honeywell faces challenges from companies like United Technologies and Siemens.Honeywell operates in a complex regulatory environment, especially for products related to building safety and aerospace.
IBM
what IBM do?
IBM is a major tech company that focuses on offering a combination of hardware, software, and consulting services to businesses.IBM is a leader in providing businesses with the tools and expertise they need to leverage the power of hybrid cloud and artificial intelligence (AI). This includes cloud computing services, AI software, and consulting services to help businesses implement these technologies.
Financials (Fundamentals) of IBM
Valuation
- Market Capitalization – 175.162 B
- Enterprise Value (MRQ) – 198.213 B
- Enterprise Value/EBITDA (TTM) – 15.5122
- Total Shares Outstanding – 916.745 M
- Number of Employees – 305.3 K
- Number of Shareholders – 378.481 K
- Price to Earnings Ratio (TTM) – 23.8150
- Price to Revenue Ratio (TTM) – 2.8996
- Price to Book (FY) – 7.8548
- Price to Sales (FY) – 2.8832
price history
- Average Volume (10 day) – 5.662 M
- 1-Year Beta – 0.6924
- 52 Week High – 199.1800
- 52 Week Low – 120.5500
Dividends
- Dividends Paid (FY) – −
- Dividend Yield Forward – 3.4752
- Dividends per Share (FY) – 6.6300
Balance Sheet as of Dec 31, 2023
- Quick Ratio (MRQ) – 0.9012
- Current Ratio (MRQ) – 0.9352
- Debt to Equity Ratio (MRQ) – 2.6599
- Net Debt (MRQ) – 46.473 B
- Total Debt (MRQ) – 59.935 B
- Total Assets (MRQ) – 135.241 B
Margins
- Net Margin (TTM) – 12.15%
- Gross Margin (TTM) – 54.62%
- Operating Margin (TTM) – 16.00%
- Pretax Margin (TTM) – 14.07%
Operating Metrics
- Return on Assets (TTM) – 0.0573
- Return on Equity (TTM) – 0.3379
- Return on Invested Capital (TTM) – 0.1033
- Revenue per Employee (FY) – 202620.3734
Income Statement
- Basic EPS (FY) – 8.2330
- Basic EPS (TTM) – 8.2227
- EPS Diluted (FY) – 8.1360
- Net Income (FY) – 7.502 B
- EBITDA (TTM) – 14.293 B
- Gross Profit (MRQ) – 10.169 B
- Gross Profit (FY) – 33.498 B
- Last Year Revenue (FY) – 61.86 B
- Total Revenue (FY) – 61.86 B
- Free Cash Flow (TTM) – 12.686 B
Why to invest in ibm?
- IBM is showing signs of renewed growth, with all three of its business segments (software, consulting, and infrastructure) experiencing growth in 2022. Analysts expect this trend to continue in 2024, with mid-single digit revenue growth projected.
- IBM is a leader in the hybrid cloud market, which is expected to grow significantly in the coming years. Hybrid cloud computing combines public cloud services with on-premises infrastructure, giving businesses more flexibility and control over their data. IBM’s acquisition of Red Hat, a leading provider of open-source cloud software, has been a key part of its hybrid cloud strategy.
- IBM is also a leader in artificial intelligence (AI), with a strong focus on developing AI for business use cases. IBM’s Watson AI platform is used by businesses in a variety of industries, including healthcare, finance, and manufacturing.
- IBM is a dividend aristocrat, a company that has increased its dividend payout for at least 25 consecutive years. This makes IBM an attractive option for income investors.
Overall, IBM is a well-established company with a strong track record of innovation.
IBM profile
| Sector | Technology Services |
| Industry | Information Technology Services |
| Employees (FY) | 305300 |
| ibm details | International Business Machines Corporation (IBM) is a technology company. The Company operates through five segments: Cognitive Solutions, Global Business Services (GBS), Technology Services & Cloud Platforms, Systems and Global Financing. The Cognitive Solutions segment delivers a spectrum of capabilities, from descriptive, predictive and prescriptive analytics to cognitive systems. Cognitive Solutions includes Watson, a cognitive computing platform that has the ability to interact in natural language, process big data, and learn from interactions with people and computers. The GBS segment provides clients with consulting, application management services and global process services. The Technology Services & Cloud Platforms segment provides information technology infrastructure services. The Systems segment provides clients with infrastructure technologies. The Global Financing segment includes client financing, commercial financing, and remanufacturing and remarketing. |
⚡Note -The company faces competition from other large tech companies, such as Amazon, Microsoft, and Google. And IBM’s stock price has been relatively stagnant in recent years.Some analysts believe IBM may be a “value trap” – a stock trading at a low price, not because of a bargain, but because the company’s future prospects are limited.IBM carries a significant amount of debt, which can limit their financial flexibility.
Intel Corporation (INTC)
What Intel corporation do?
Intel is one of the world’s largest manufacturers of semiconductor chips, the tiny brains behind most electronic devices. They’re famous for their central processing units (CPUs) that power computers, but also make other chips for various purposes.
financials (fundamentals) of Intel corporation
valuation
- Market Capitalization – 180.282 B
- Enterprise Value (MRQ) – 243.103 B
- Enterprise Value/EBITDA (TTM) – 21.7295
- Total Shares Outstanding – 4.228 B
- Number of Employees – 124.8 K
- Number of Shareholders – 97 K
- Price to Earnings Ratio (TTM) – 110.8087
- Price to Revenue Ratio (TTM) – 3.3583
- Price to Book (FY) – 1.7118
- Price to Sales (FY) – 3.3205
price history
- Average Volume (10 day) – 49.969 M
- 1-Year Beta – 2.1980
- 52 Week High – 51.2800
- 52 Week Low – 26.8550
Dividends
- Dividends Paid (FY) – −3.088 B
- Dividend Yield Forward – 1.1726
- Dividends per Share (FY) – 0.7400
Balance Sheetas of Dec 31, 2023
- Quick Ratio (MRQ) – 1.1458
- Current Ratio (MRQ) – 1.5424
- Debt to Equity Ratio (MRQ) – 0.4707
- Net Debt (MRQ) – 24.663 B
- Total Debt (MRQ) – 49.697 B
- Total Assets (MRQ) – 191.572 B
Margins
- Net Margin (TTM) – 3.11%
- Gross Margin (TTM) – 40.04%
- Operating Margin (TTM) – 0.06%
- Pretax Margin (TTM) – 1.41%
Operating Metrics
- Return on Assets (TTM) – 0.0090
- Return on Equity (TTM) – 0.0163
- Return on Invested Capital (TTM) – 0.0116
- Revenue per Employee (FY) – 434519.2308
Income Statement
- Basic EPS (FY) – 0.4031
- Basic EPS (TTM) – 0.3930
- EPS Diluted (FY) – 0.4010
- Net Income (FY) – 1.689 B
- EBITDA (TTM) – 9.633 B
- Gross Profit (MRQ) – 7.047 B
- Gross Profit (FY) – 21.539 B
- Last Year Revenue (FY) – 54.228 B
- Total Revenue (FY) – 54.228 B
- Free Cash Flow (TTM) – −14.279 B
Why to invest in Intel corporation?
- The PC market, a key source of revenue for Intel, appears to be recovering after a slump.After a rough patch, Intel is showing signs of a turnaround.
- Intel invests heavily in R&D, which is crucial for staying ahead of the competition in the fast-paced chipmaking industry.Intel has a well-established manufacturing infrastructure with a global network of foundries
- Intel is a household name with a long history of innovation in the chipmaking industry.This brand recognition gives them a significant advantage in the market. Their reputation for quality and reliability can give investors confidence.
Intel profile
| Sector | Electronic Technology |
| Industry | Semiconductors |
| Employees (FY) | 124800 |
| Intel corporation details | Intel Corporation engages in the design, manufacture, and sale of computer products and technologies. It delivers computer, networking, data storage, and communications platforms. The firm operates through the following segments: Client Computing Group (CCG), Data Center Group (DCG), Internet of Things Group (IOTG), Non-Volatile Memory Solutions Group (NSG), Programmable Solutions (PSG), and All Other. The CCG segment consists of platforms designed for notebooks, 2-in-1 systems, desktops, tablets, phones, wireless and wired connectivity products, and mobile communication components. The DCG segment includes workload-optimized platforms and related products designed for enterprise, cloud, and communication infrastructure market. The IOTG segment offers compute solutions for targeted verticals and embedded applications for the retail, manufacturing, health care, energy, automotive, and government market segments. The NSG segment constitutes of NAND flash memory products primarily used in solid-state drives. The PSG segment contains programmable semiconductors and related products for a broad range of markets, including communications, data center, industrial, military, and automotive. The All Other segment consists of results from other non-reportable segment and corporate-related charges. The company was founded by Robert Norton Noyce and Gordon Earle Moore on July 18, 1968 and is headquartered in Santa Clara, CA. |
⚡Note Intel has faced delays and cost overruns in developing its latest manufacturing processes. This can put them at a disadvantage compared to competitors who can produce chips more efficiently While Intel dominates the PC processor market, they haven’t been as successful in mobile devices. This puts them at a disadvantage as the smartphone and tablet market continues to grow.Intel has a significant amount of debt, which could limit their financial flexibility and hinder future growth.
D wave (QBTS)
What Dwave do?
Dwave founded in 1999.”D-Wave is a Canadian company that develops quantum computers. They focus on a specific type of quantum computing called quantum annealing.”
They’re the world’s first commercial supplier of quantum computers and offer a unique approach with both annealing and gate-model machines.
D-Wave builds quantum computers that use a process called quantum annealing to tackle specific types of problems, particularly optimization problems. These problems involve finding the best solution from a large set of possibilities.D-Wave offers cloud access to their quantum computers through Leap.
D-Wave creates software tools and services to help users develop applications for their quantum computers.
financials (fundamentals ) of dwave (QBTS)
valuation
- Market Capitalization – 235.875 M
- Enterprise Value (MRQ) – 122.722 M
- Enterprise Value/EBITDA (TTM) – —
- Total Shares Outstanding – 113.402 M
- Number of Employees – 215
- Number of Shareholders – 150
- Price to Earnings Ratio (TTM) – —
- Price to Revenue Ratio (TTM) – 33.2773
- Price to Book (FY) – —
- Price to Sales (FY) – 34.3614
price history
- Average Volume (10 day) – 6.51 M
- 1-Year Beta – 3.9205
- 52 Week High – 3.2000
- 52 Week Low – 0.3962
Dividends
- Dividends Paid (FY)0
- Dividend Yield Forward—
- Dividends per Share (FY)0
Balance Sheet as of Sep 30, 2023
- Quick Ratio (MRQ)1.2913
- Current Ratio (MRQ)1.3431
- Debt to Equity Ratio (MRQ)5.3994
- Net Debt (MRQ)−5.824 M
- Total Debt (MRQ)47.493 M
- Total Assets (MRQ)70.179 M
Margins
- Net Margin (TTM) – −970.00%
- Gross Margin (TTM) – 47.35%
- Operating Margin (TTM) – −1037.52%
- Pretax Margin (TTM) – −970.00%
Operating Metrics
- Return on Assets (TTM) – -1.4723
- Return on Equity (TTM) – -19.7863
- Return on Invested Capital (TTM) – -3.7034
- Revenue per Employee (FY) – 33362.7907
Income Statement
- Basic EPS (FY) – -0.4307
- Basic EPS (TTM) – -0.6432
- EPS Diluted (FY) – -0.4307
- Net Income (FY) – −51.529 M
- EBITDA (TTM) – −83.458 M
- Gross Profit (MRQ) – 1.529 M
- Gross Profit (FY) – 4.25 M
- Last Year Revenue (FY) – 7.173 M
- Total Revenue (FY) – 7.173 M
- Free Cash Flow (TTM) – −54.385 M
Why to invest in dwave?
- D-Wave is a company at the forefront of quantum computing, a technology with the potential to revolutionize many fields.
- D-Wave specializes in quantum computers that use a process called quantum annealing. This approach is particularly suited for optimization problems, which involve finding the best solution among many possibilities.
- Their machines are known for their speed and ease of use for specific tasks.D-Wave systems excel at solving optimization problems – finding the best solution among many possibilities.
Dwave profile
| Sector | Electronic Technology |
| Industry | Computer Processing Hardware |
| Employees (FY) | 215 |
| dwave details | D-Wave Quantum, Inc. engages in the development and delivery of quantum computing systems, software, and services. It provides customers with access to the company’s quantum computing systems via the cloud in the form of quantum computing as a service. It offers professional services such as customer assistance in identifying and implementing quantum-computing applications. The company was founded on January 25, 2022 and is headquartered in Palo Alto, CA. |
⚡Note D-Wave’s current systems have a limited number of qubits compared to other quantum computing platforms. D-Wave systems are designed for quantum annealing, which is good for specific optimization problems. However, they are not suited for universal quantum computation, which has a wider range of applications.
Rigetti (RGTI)
What rigetti do?
Rigetti is founded in 2013
Rigetti Computing is a company on the cutting edge of quantum computing, a rapidly developing field. They Build powerful quantum computers to tackle problems beyond the reach of even today’s supercomputers.Develops quantum integrated circuits, the core building blocks of quantum computers.
Offers a cloud platform called Forest for programmers to write quantum algorithms, the special instructions that run on quantum computers.Considers itself a full-stack quantum computing company, meaning they design, manufacture, and develop software for their hardware.Their hardware focuses on creating the core processing unit of a quantum computer, known as a Quantum Processing Unit (QPU).
financials (fundamentals ) of rigetti
Valuation
- Market Capitalization – 312.201 M
- Enterprise Value (MRQ) – 69.051 M
- Enterprise Value/EBITDA (TTM) – —
- Total Shares Outstanding – 158.881 M
- Number of Employees – 134
- Number of Shareholders – 168
- Price to Earnings Ratio (TTM) – —
- Price to Revenue Ratio (TTM) – 23.1712
- Price to Book (FY) – 2.6571
- Price to Sales (FY) – 21.7617
Price History
- Average Volume (10 day) – 10.426 M
- 1-Year Beta – 1.8986
- 52 Week High – 3.4300
- 52 Week Low – 0.3601
Dividends
- Dividends Paid (FY) – 0
- Dividend Yield Forward – —
- Dividends per Share (FY) – 0
Balance Sheet as of Dec 31, 2023
- Quick Ratio (MRQ) – 3.7060
- Current Ratio (MRQ) – 3.7060
- Debt to Equity Ratio (MRQ) – 0.2789
- Net Debt (MRQ) – −69.364 M
- Total Debt (MRQ) – 30.565 M
- Total Assets (MRQ) – 159.913 M
Margins
- Net Margin (TTM) – −625.42%
- Gross Margin (TTM) – 0.83%
- Operating Margin (TTM) – −593.75%
- Pretax Margin (TTM) – −625.42%
Operating Metrics
- Return on Assets (TTM) – -0.4134
- Return on Equity (TTM) – -0.5782
- Return on Invested Capital (TTM) – -0.4933
- Revenue per Employee (FY) – 89611.9403
Income Statement
- Basic EPS (FY) – -0.5691
- Basic EPS (TTM) – -0.5746
- EPS Diluted (FY) – -0.5691
- Net Income (FY) – −75.107 M
- EBITDA (TTM) – −62.196 M
- Gross Profit (MRQ) – 1.077 M
- Gross Profit (FY) – 100 K
- Last Year Revenue (FY) – 12.008 M
- Total Revenue (FY) – 12.008 M
- Free Cash Flow (TTM) – −59.638 M
Why to invest in rigetti?
- Quantum computing is a rapidly developing field with the potential to revolutionize many industries. If Rigetti can become a leader in this field, its stock price could soar.
- Rigetti is one of the leading companies developing quantum computers. This gives them a first-mover advantage in a rapidly growing market.
- Rigetti has partnerships with several government agencies and national labs, which could lead to future sales of their quantum computing systems. They’ve also made their first sales of QPUs (Quantum Processing Units).
rigetti profile
| Sector | Electronic Technology |
| Industry | Computer Processing Hardware |
| Employees (FY) | 134 |
| rigetti details | Rigetti Computing, Inc. provides full-stack quantum computing services. It serves global enterprise, government, and research clients through its Rigetti Quantum Cloud Services platform. The company was founded by Chad Rigetti in 2013 and is headquartered in Berkeley, CA. |
⚡Note – Quantum computing research and development is expensive. Rigetti may require substantial additional funding in the future, potentially diluting the value of existing shares.Currently, quantum computers are not powerful enough to solve many real-world problems. It may be some time before quantum computers become commercially viable. High competition: Rigetti faces competition from a number of other companies developing quantum computers, including IBM, Google, and Microsoft
formfactor Inc (FMF)
What formfactor do?
FormFactor, Inc. is a leading provider of essential test and measurement technologies along the full integrated circuit (IC) life cycle, from characterization, modeling, reliability, and design debug, to qualification and production test .
FormFactor was founded in 1993 and is headquartered in Fremont, California. The company has over 2,115 employees in December 31, 2023 and serves customers around the world.
FormFactor offers a variety of products, including probe stations, probes, probe cards, advanced thermal subsystems, and cryogenic systems for quantum development.The company also provides related services, such as training and support.FormFactor’s customers include some of the world’s largest semiconductor companies.
financials (fundamentals ) of formfactor Inc
Valuation
- Market Capitalization – 3.04 B
- Enterprise Value (MRQ) – 2.708 B
- Enterprise Value/EBITDA (TTM) – 54.4228
- Total Shares Outstanding – 77.598 M
- Number of Employees – 2.115k
- Number of Shareholders – 115
- Price to Earnings Ratio (TTM) – 41.2162
- Price to Revenue Ratio (TTM) – 5.1227
- Price to Book (FY) – 3.6885
- Price to Sales (FY) – 5.1063
Price History
- Average Volume (10 day) – —
- 1-Year Beta – 1.7890
- 52 Week High – —
- 52 Week Low – —
Dividends
- Dividends Paid (FY) – 0
- Dividend Yield Forward – —
- Dividends per Share (FY) – 0
Balance Sheet as of Dec 31, 2023
- Quick Ratio (MRQ) – 3.5249
- Current Ratio (MRQ) – 4.3768
- Debt to Equity Ratio (MRQ) – 0.0530
- Net Debt (MRQ) – −254.884 M
- Total Debt (MRQ) – 43.62 M
- Total Assets (MRQ) – 1.003 B
Margins
- Net Margin (TTM) – 12.42%
- Gross Margin (TTM) – 38.92%
- Operating Margin (TTM) – 1.76%
- Pretax Margin (TTM) – 13.46%
Operating Metrics
- Return on Assets (TTM) – 0.0779
- Return on Equity (TTM) – 0.0960
- Return on Invested Capital (TTM) – 0.0917
- Revenue per Employee (FY) – 284055.4879
Income Statement
- Basic EPS (FY) – 0.9647
- Basic EPS (TTM) – 0.9611
- EPS Diluted (FY) – 0.9550
- Net Income (FY) – 74.643 M
- EBITDA (TTM) – 51.171 M
- Gross Profit (MRQ) – 61.339 M
- Gross Profit (FY) – 230.984 M
- Last Year Revenue (FY) – 600.777 M
- Total Revenue (FY) – 600.777 M
- Free Cash Flow (TTM) – 7.769 M
Why to invest in formfactor Inc
- The semiconductor industry is on an upward trend, and FormFactor supplies essential testing equipment used throughout the lifecycle of a chip.
- FormFactor is involved in areas like quantum computing, which is seen as a high-growth sector.
formfactor profile
| Sector | Electronic Technology |
| Industry | Semiconductors |
| Employees (FY) | 2115 |
| formfactor details | FormFactor, Inc. engages in the provision of test and measurement solutions. It operates through the following business segments: Probe Cards and Systems. The Probe Cards segment consists of technologies and product architectures, including micro-electromechanical systems technologies. The Systems segment consists of analytical probe solutions for on-wafer probing, board tests, and package tests. The company was founded by Igor Khandros on April 15, 1993 and is headquartered in Livermore, CA. |
⚡Note – FormFactor relies heavily on the semiconductor industry’s health.New testing methods or technologies could render FormFactor’s equipment obsolete.
Disclaimer – It’s important to do your own research before making any investment decisions. Consider your own risk tolerance and investment goals.
The field of quantum computing is rapidly evolving, with the potential to revolutionize various industries. While there are no pure-play, established giants in the space yet, several companies are making significant strides. This list encompassing Nvidia, IonQ, Alphabet (Google), Microsoft, FormFactor, D-Wave, Rigetti, Intel, IBM, and Honeywell offers a glimpse into the players shaping this nascent field.Investing in quantum computing stocks carries inherent risk, as the technology is still in its early stages. However, for investors with a long-term outlook and a tolerance for risk, these companies offer a chance to be at the forefront of a groundbreaking technological revolution. Careful research and due diligence are essential before investing in any of these companies.
FAQ?
Q : What is (TTM)?
Ans. This is the current Price divided by Cash Flow Per Share for the trailing twelve months.
Q : What is MRQ?

Ans. MRQ = Most Recent Quarter it refers to the latest completed fiscal quarter for a company. It provides a snapshot of the company’s performance metrics like sales, earnings, and financial health during that particular three-month period.
Q: What is (FY)?
Ans. FY stands for Fiscal Year. It’s a 12-month or 52-week period that businesses and governments use for accounting purposes, rather than the standard calendar year. This means their financial reports and budgets are based on this specific FY timeframe.
Q: What makes quantum computing stocks different from other tech stocks?
Ans. Quantum computing is a revolutionary technology with the potential to solve problems impossible for classical computers.Quantum computing is still in its early stages. While the potential for breakthroughs is immense, these companies are tackling complex scientific challenges, and success isn’t guaranteed. This translates to high risk for investors but also the possibility of high returns if the companies succeed.There are pure-play quantum computing companies like IonQ (IONQ) that focus solely on this technology. Then there are established tech giants like IBM (IBM) and Microsoft (MSFT) with ongoing quantum research alongside their other businesses.
Q: Where can I find these stocks?
Ans. You can find some publicly traded quantum computing stocks like IonQ (IONQ) and Rigetti Computing (RGTI) on major stock exchanges. There’s also a quantum computing ETF (exchange-traded fund) that allows you to invest in a basket of these companies.
Q: what is debt to equity Ratio?
Ans. The debt-to-equity (D/E) ratio is a financial metric used to analyze how a company finances its operations. It essentially compares how much debt a company has on its books compared to the investment from its shareholders.
Q: What is EBIDTA?
Ans. EBITDA stands for Earnings Before Interest, Taxes, Depreciation, and Amortization. It’s a financial metric used to assess a company’s profitability from its core operations, excluding certain financial decisions and accounting practices.
Q: what is Price to Earnings Ratio?
Ans. The price-to-earnings ratio, or P/E ratio, is a metric used to assess the value of a company’s stock. It compares the current market price of a share of a company’s stock to its earnings per share (EPS). it tells you how much an investor is willing to pay for every rupee of the company’s profit.
Q:What is 1-Year Beta?
Ans. 1-year beta is a measurement used to assess the volatility of a company’s stock price compared to the overall market (often represented by an index like the S&P 500) over a one-year period.
It essentially tells you how much a specific stock’s price tends to move in relation to the market’s movement.
Q: What is Pretax Margin?
Ans. The pretax margin, also known as the EBT (Earnings Before Taxes) margin, is a financial ratio that helps assess a company’s operating efficiency. It tells you what percentage of a company’s revenue translates into profit before taxes are deducted. Pretax margin can be calculated as Pretax Margin = (Earnings Before Taxes (EBT) / Revenue) x 100%
Q: What is basic EPS and EPS diluted?
Ans. Basic earnings per share (EPS) is a financial metric used to assess a company’s profitability per common share. It tells investors how much of a company’s profit is allocated to each share of common stock. Diluted EPS (earnings per share) builds on the concept of basic EPS but takes a more conservative approach. It considers the impact of all convertible securities on a company’s profitability per share.
Q: What is dividends?

Ans. Dividends are essentially a portion of a company’s profits that are paid out to its shareholders.expand_more
Think of it as a reward for investing in the company.expand_more
These payouts are typically made on a regular basis, like quarterly or annually, and can be in the form of cash or even additional shares of stock.expand_more
Q: Is QS a good stock?
Ans. Analysts are currently giving QuantumScape (QS) a moderate sell rating, with an average price target of $6.50 in the next 12 months. This represents a potential upside of 14.24% from the current price.Risks: QS is a high-risk, high-reward stock. The company is developing a new battery technology that has the potential to revolutionize the electric vehicle industry, but it’s still in the early stages of development. Rewards: If QS is successful in developing its battery technology, the stock price could soar. The company has the potential to be a major player in the electric vehicle industry.
Q: What are the 4 states of Quantum computing?
Ans. Quantum computers don’t exactly have states like “on” or “off” the way your phone might. Instead, they exploit the strangeness of quantum mechanics to process information in fundamentally new ways. key difference Between Regular Computer and Quantum Computer:
Regular computers: Bits are like tiny switches, either on (1) or off (0). Two bits together can be in four states: 00, 01, 10, or 11. It’s like flipping two coins, heads or tails for each.Quantum computers: Qubits, the quantum equivalent of bits, can be in both states at the same time. This weirdness is called superposition. Imagine a special coin that can be heads, tails, or both at once! With two qubits, it’s like having two of these special coins. They can represent all four combinations (00, 01, 10, 11) simultaneously.This lets quantum computers explore many possibilities at once, like trying all paths in a maze concurrently. This parallel processing gives them the potential to solve certain problems much faster than regular computers.Here’s an analogy: Regular computer: Searching a maze room by room, one path at a time.Quantum computer: Exploring all the rooms simultaneously, finding the exit much faster.
Q: What is Free Cash Flow?
Ans. Free Cash Flow (FCF) is essentially the cash a company has left over after accounting for all its expenses and reinvestments into its business. It’s a metric that helps understand a company’s financial health and its ability to generate cash.Free Cash Flow Formula:FCF = Cash from Operations – Capital Expenditures
Mortgage calculator – click here
ROI Calculator – click here
loan calculator – click here
Stock Market Simulator –https://technologynile.com/stock-market-simulator/
