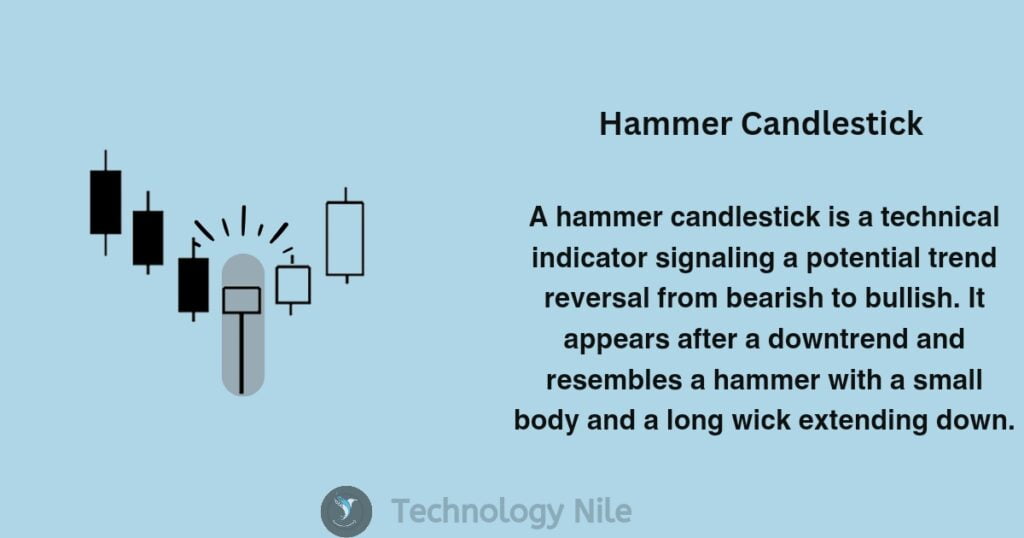
What is Hammer Candlestick Pattern?

Hammer is a bullish Reversal Candlestick Pattern.
The hammer candlestick pattern is a significant indicator used in technical analysis, specifically in candlestick charting, to identify potential reversals in a downtrend
Hammer Candlestick Structure
- Small Real Body: Located near the top of the trading range. Indecision or struggle between buyers and sellers.
- Lower Wick – The lower wick is typically at least twice the length of the body (the difference between open and close). This signifies strong buying pressure at the lows, pushing the price back up.long lower wick, indicating a significant price drop followed by a recovery.
- Upper wick – The upper wick (if present) is ideally minimal or absent.Limited selling pressure at the highs.
Opening price: This is the price at the start of the trading period.
Closing price: This is the price at the end of the trading period.
closes at the price higher or nearer to the opening price.
Key Takeaways
- It appears at the end of a downtrend.Small real body, long lower wick (at least twice the body length), and ideally minimal upper wick.
- The long lower wick signifies buyers rejecting a price decline during the trading period.
- The next candle closing above the hammer’s closing price strengthens the reversal signal.
How Does it Works?
The hammer candlestick pattern suggests a potential bullish reversal. It indicates that during the trading period, sellers initially drove the price down. However, buyers stepped in and pushed the price back up, ultimately causing the price to close near its opening level. This price action signifies a potential shift in momentum, where the bears are losing control, and the bulls are gaining strength
Structure
- Appears at the end of a downtrend.
- The body of the candlestick is small, representing a narrow difference between the opening and closing prices.
- The lower wick is at least twice as long as the body, indicating a significant price drop during the trading period.
- There may be a short upper wick or no upper wick at all.
Limitations
- Hammer candlestick patterns don’t predict future price movements with certainty.
- Other technical indicators and analysis should be considered to improve trading decisions.
Overall, the hammer candlestick pattern is a valuable tool for traders to identify potential buying opportunities after a downtrend. However, it’s crucial to use it in conjunction with other technical analysis methods and risk management strategies.
FAQ?
Q: Is the hammer bullish or bearish?
Ans. Hammer is a bullish Reversal Candlestick Pattern.It appears at the end of a downtrend and signifies a potential shift in momentum where sellers are losing control and buyers are gaining strength.
Q: What is the success rate of hammer candlesticks?
Ans. The success rate of hammer candlestick patterns is generally estimated to be around 50%. This means it’s not a foolproof indicator and shouldn’t be relied upon solely for trading decisions.
Q: How do you read a hammer candlestick?
Ans. Reading a hammer candlestick involves understanding its structure, position in the chart, and the context of the surrounding price movement.The body of the hammer candlestick represents the difference between the opening and closing prices. In a bullish hammer, the body is typically small, indicating a narrow trading range.
This is the key element of the hammer. It extends significantly below the body, ideally at least twice the length of the body.Ideally, there should be a minimal or absent upper wick.The hammer candlestick pattern is most significant when it appears at the end of a downtrend. This suggests a potential reversal in the downtrend as buying pressure emerges.
Q Is Hammer Candlestick Can be red?
A hammer candlestick can be red. The color of the body in a hammer pattern doesn’t tell the whole story . it can be either red or green.
both red and green hammer candlesticks are bullish signals.